Cold Plate Thermal Resistance: Comparing AI Server Cooling Data
A lower cold plate thermal resistance can indicate better cooling—but only when the values describe the same thermal path and comparable operating conditions. Before ranking two designs, check the temperature reference points, heat-source layout, coolant conditions and flow available to each plate. Then read the thermal result alongside its pressure drop.
This matters when reviewing cooling options for an AI server. One supplier may report a cold plate surface temperature; another may use processor case temperature. One curve may include the thermal interface material, while another excludes it. The numbers can look comparable without measuring the same thing.
For an AI server and GPU liquid-cooling project, the useful question is not simply which supplier publishes the lowest value. It is which design can meet the device temperature limit under your installation conditions—and what evidence supports that conclusion.
Identify the Temperature Reference Points First
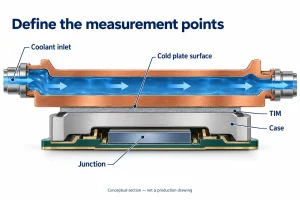
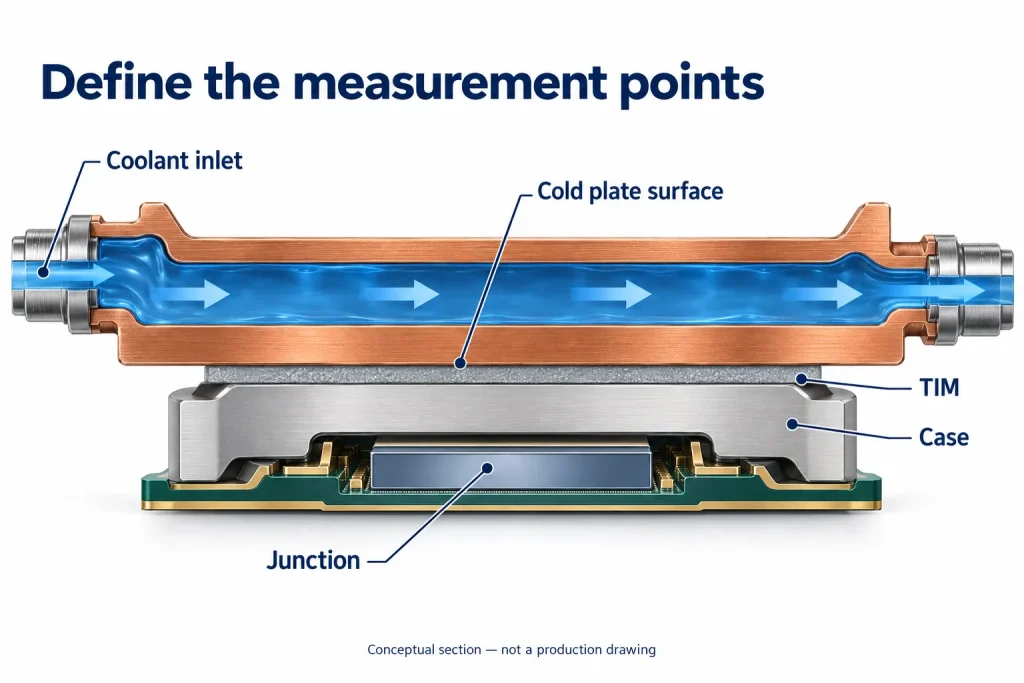
Before comparing cold plate thermal resistance, ask where each temperature was measured. The basic calculation is:
R = (T_hot − T_reference) / Q
Here, Q is the heat load used in the calculation. Resistance is expressed in K/W or °C/W; the two units have the same numerical value for a temperature difference. Record how Q was determined, including any correction for heat that did not enter the intended cooling path.
The equation alone does not define the measurement boundary. A cold plate surface-to-inlet result is not interchangeable with processor case-to-inlet or junction-to-inlet resistance. Depending on the endpoints, the reported value may include the thermal interface material, the processor package, or neither.
For example, the OCP cold plate development and qualification white paper calculates resistance from processor case temperature to incoming coolant temperature using applied power. That is a different boundary from measuring the cold plate surface directly.
The coolant reference also matters. Inlet temperature, local coolant temperature near a heat source, and a defined mean coolant temperature are different references. Eaton’s cold plate performance comparison, for instance, uses local liquid temperature and area-normalized curves.
Before placing two results side by side, request three clarifications:
– The exact hot-side measurement point and whether it represents a maximum or an average.
– The coolant reference location and calculation method.
– The reported units, including any area normalization and the area used.
Without these details, a lower published number is not enough to identify the better cold plate for your server.
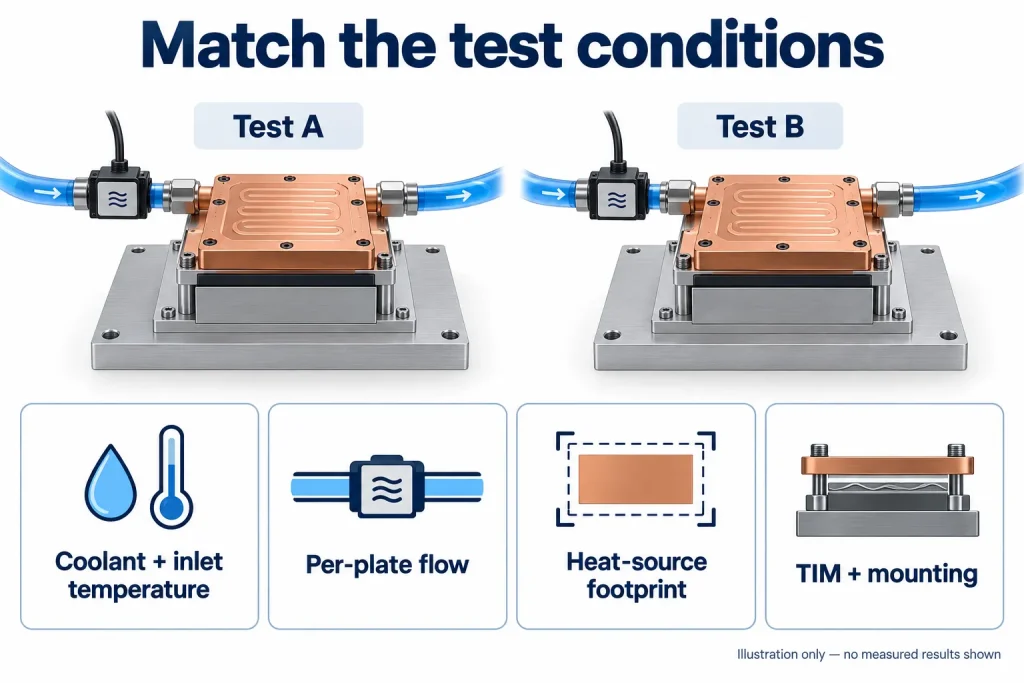
Match Test Conditions Before Comparing Results
Put the test conditions beside each result before deciding which cold plate performs better. A lower reported thermal resistance is useful only when the comparison represents the same cooling task. Start with the following checks.
| Condition | What to compare |
|---|---|
| Coolant and inlet temperature | Fluid type, glycol concentration where applicable, and coolant temperature entering the plate |
| Flow through the plate | Per-plate flow rate, flow direction and port configuration—not total rack or manifold flow |
| Heat-source layout | Heater dimensions, locations, power per device and how power is distributed across each contact area |
| Thermal interface and mounting | TIM type and thickness or application method, mounting procedure and the hardware revision tested |
Two plates tested at the same total power can face different challenges. A distributed heater does not reproduce several concentrated chip footprints. Check that the test layout represents the package envelope and heat map you need to cool. Eaton’s custom cold plate design guidance likewise treats heat-source dimensions, locations and individual loads as design inputs.
Mounting also belongs in the comparison. Record whether each assembly uses the same interface material and installation procedure. Otherwise, the reported difference may include changes outside the cold plate itself.
Use the cold plate flow-rate calculation guide to check the relationship between heat load, flow and bulk coolant temperature rise. That calculation does not establish local temperatures beneath individual processors.
When conditions differ, ask suppliers to identify the differences and, where practical, provide another test point under shared conditions. Do not treat a simple scaling adjustment as proof of equivalent performance. Mark unmatched results as provisional rather than ranking them as directly comparable.
Read Thermal Resistance and Pressure Drop Together
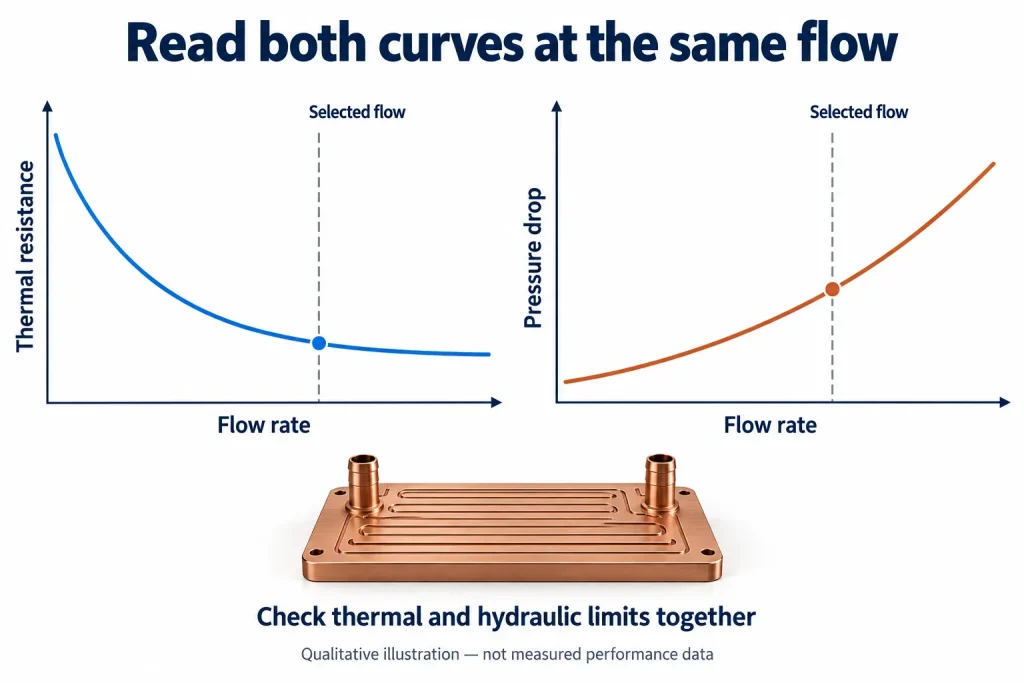
A cold plate’s lowest thermal resistance is not automatically its most useful operating point. If that result requires more flow than the server branch can provide, it does not describe the performance available in your installation.
Request thermal resistance and pressure-drop data at matching flow rates. A practical published example is the ATS-CP-1003 performance table, which places flow, thermal resistance and pressure drop together. The useful feature here is the reporting format—not a performance benchmark for a different server design.
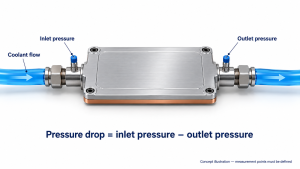
Keep the units separate: thermal resistance is expressed in °C/W; hydraulic pressure drop is expressed in Pa or kPa. Pressure drop during coolant flow is not the same as static operating pressure or a leak-test pressure.
For a supplier comparison, ask two distinct questions:
- At the same flow: Which design provides the lower temperature rise for the same heat load, and what pressure drop accompanies that result?
- At the same available pressure difference: What flow can each design receive, and what thermal resistance corresponds to that flow?
These comparisons answer different questions. Decide which reflects your project before ranking candidates.
Also mark the measurement boundary. Does the quoted pressure drop cover the bare plate, its fittings, or an assembly including quick disconnects? Do both suppliers include the same components?
Identify the operating points inside both your per-plate flow range and allocated pressure-drop budget. Ask suppliers to highlight those points—not simply the lowest thermal-resistance number anywhere on the chart.
Separate Measured Results from Simulations and Targets
Before comparing thermal resistance values, identify what each number represents: a physical test result, a CFD prediction or a design target. Keep those labels beside the values in your comparison sheet. A target states what the design needs to achieve; it does not show that a prototype has passed a test.
For measured results, ask which part revision was tested and how closely the fixture represents the intended installation. Sensor locations, instrument accuracy, calibration status and the rule used to identify stable conditions all affect how confidently you can interpret a small difference between designs. A single reported value also tells you little about repeatability unless the supplier explains the number of samples and repeated runs.
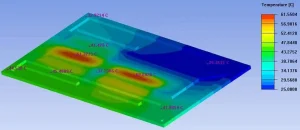
For simulations, look beyond the temperature plot. Ask which boundary conditions were imposed, how the thermal interface material and contact resistance were represented, and whether the model was compared with physical measurements. If correlation was performed, clarify which configuration was tested and where the model and measurements differed. Agreement for one configuration does not establish accuracy for every operating condition.
A clearly documented test can be more useful than a lower, unexplained thermal resistance value. Treat missing information as an open question—not proof that a design is poor—and resolve it before using the comparison to select a supplier.
Request a Comparable Performance Record
Before choosing between two cold plates, ask each supplier to return a short results record in the same format. The aim is not more paperwork: it is to establish whether the reported figures describe comparable conditions.
| Information group | What the record should include |
|---|---|
| Part and data status | Sample identifier, drawing revision, and whether each result is measured, simulated or a design target |
| Thermal inputs and readings | Heat-source layout, applied heat load and how it was determined, hot-side temperature and sensor location, coolant temperature reference, and thermal-resistance definition, units and value |
| Fluid and hydraulic conditions | Coolant composition, inlet temperature, flow through the tested plate, and pressure drop with its measurement boundaries |
| Setup and limitations | Mounting and thermal-interface conditions, relevant measurement uncertainty, assumptions, and missing or unverified information |
If a field was not recorded, mark it as unavailable. Do not fill gaps with estimates without identifying them. An outlet temperature, for example, should not be presented as a measurement if it was calculated.
Compare results at your intended operating point, not only at the most favorable point on each curve. Where conditions differ, request clarification before treating a lower thermal resistance as a better design.
To discuss a custom liquid cold plate with Ecotherm, share the existing datasheet or performance curve, heat-source layout and intended operating conditions. Identify which comparison fields remain open so the discussion starts with a clearly defined cooling task.