Cold Plate Pressure Drop for AI Servers: How to Compare Flow Curves
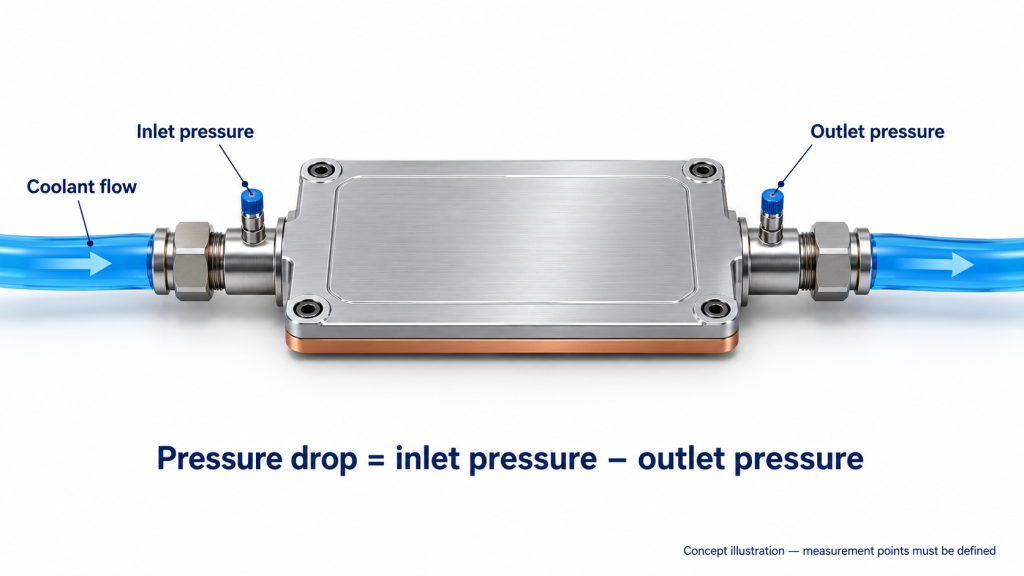
Cold plate pressure drop tells you how much pressure is lost across a defined flow path at a particular coolant flow rate. It does not tell you, on its own, whether an AI server cold plate can meet the processor’s temperature limit.
Before comparing supplier curves, align the coolant, temperature, flow rate and measurement boundary. Then read the pressure-drop and thermal-performance data together. A smaller pressure-loss number is useful only when the proposed cooling assembly also meets the thermal requirement.
What Does Cold Plate Pressure Drop Actually Mean?
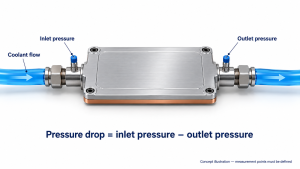
During circulation, coolant pressure is measured at the inlet and outlet of the cold plate or specified assembly. For readings at comparable elevations and using the same pressure basis:
Pressure drop = inlet pressure − outlet pressure
An upstream pressure reading alone does not establish this difference. A datasheet entry labelled only “pressure” is incomplete unless it identifies what was measured and at what flow.
Keep four different specifications separate:
- Flow pressure drop: the inlet-to-outlet pressure difference during circulation.
Working pressure limit: the allowable service pressure under specified conditions.
Proof-test pressure: the pressure applied during a defined structural verification.
Pressure-decay result: pressure change over time during an isolated leak test.
These figures answer different questions. A component can pass a leak test without demonstrating that its hydraulic resistance suits the cooling loop. OCP discusses flow-pressure performance and hydrostatic reliability testing separately in its cold plate development and qualification guidance.
For a usable flow curve, request the inlet-to-outlet pressure difference at several specified flow points. Equipment manufacturers describe this as controlled flow-resistance testing, with flow, temperature and differential pressure recorded. BRT’s test-bench documentation provides one example; its equipment specifications are not universal cold plate acceptance limits.
Check the Conditions Behind the Flow Curve
Read the curve’s notes before comparing the lines. Record the coolant product, concentration, concentration basis and temperature. “Water-glycol” without a composition is not a complete test-fluid description.
Fluid properties matter. Viscosity and density vary with fluid formulation and temperature, so a water test cannot automatically represent the selected glycol mixture. There is no universal percentage correction that makes every water curve equivalent to a glycol curve. Dow’s heat-transfer fluid calculator treats temperature and concentration as inputs when evaluating fluid properties and pressure loss.
Ecotherm’s coolant property calculator can support preliminary estimates. For final review, use the selected coolant supplier’s data and confirm the concentration basis.
Next, check the axes. Convert pressure and flow units consistently, but do not confuse unit conversion with a correction for different fluids or temperatures.
Ask whether the supplied curve is:
Measured from a physical sample.
Predicted by simulation.
Fitted to measured points.
Request the underlying points and the conditions recorded at each point. A smooth fitted line does not establish performance outside the tested range. If your required flow lies beyond the available data, ask for additional evidence rather than extending the curve by eye.
Keep the test report linked to the drawing revision. If the channel layout, ports or connectors change, ask whether the existing curve still represents the proposed part.
Read Pressure Drop Together with Thermal Performance
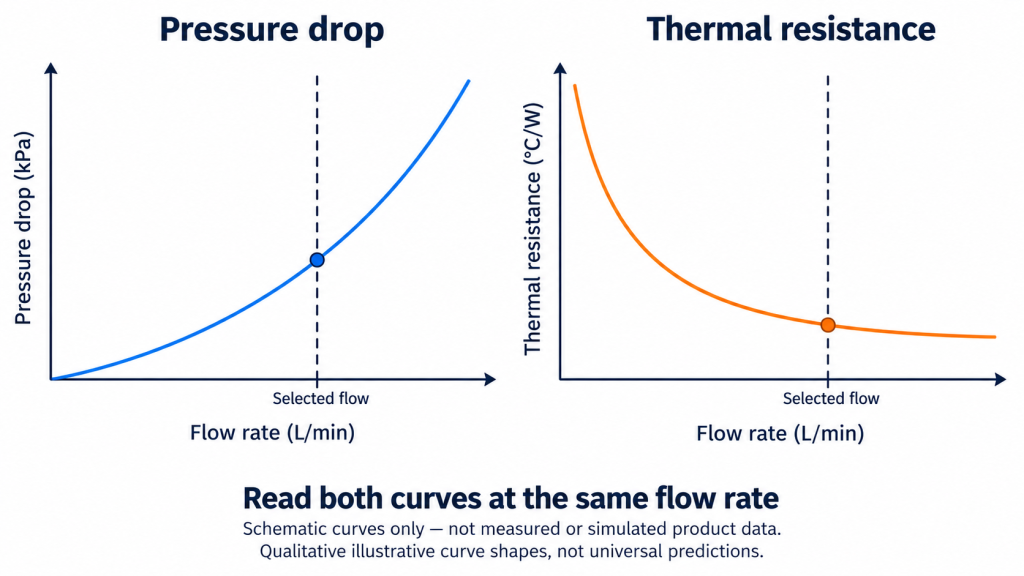
Choose a flow point and read both the pressure drop and the thermal result there. Do not pair a low pressure drop quoted at one flow with a thermal resistance quoted at a higher flow.
If the required flow has not been established, begin with the thermal requirement. Our cold plate flow-rate calculation guide explains the heat-balance starting point. This article focuses on checking supplier data once a candidate operating range is available.
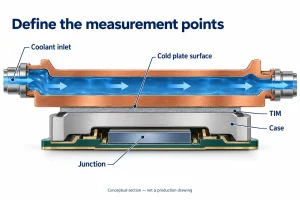
For the thermal curve, confirm the definition behind the number. Temperature may be referenced to the component case, the cold plate surface, inlet coolant or local coolant. Also establish whether the measured path includes the thermal interface material.
These distinctions occur in public technical sources. OCP describes a case-to-inlet calculation under defined test conditions, while Eaton’s cold plate performance comparison uses a surface-to-local-fluid reference. Values using those different definitions should not be ranked directly.
For each candidate, check:
Is the pressure loss acceptable at the selected flow?
Does the thermal result meet the agreed temperature requirement?
Do the heat source, interface and temperature references represent your application?
A same-flow comparison helps screen components. It does not prove the installed circuit will deliver that flow. The final review must include the available differential pressure and the resistance of the relevant flow path.
The accompanying curves are schematic reading aids, not product predictions. Their purpose is to show where to read the two results—not to specify a universal relationship or an Ecotherm performance claim.
Separate the Cold Plate from the Complete Assembly
A plate-only curve and an assembly curve can both be valid. They describe different boundaries.
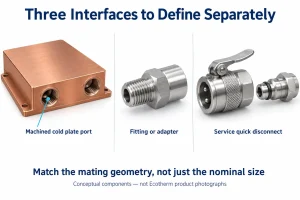
Hoses, quick disconnects, adapters and manifolds may sit outside a plate-only measurement. If those parts are included in the delivered assembly, the plate-only result does not describe its complete pressure loss.
Datasheet footnotes sometimes make this distinction explicit. One published cold plate datasheet states that its pressure drop excludes fittings and identifies the test coolant. Those notes describe that product; they are not specifications for Ecotherm or AI server cold plates generally.
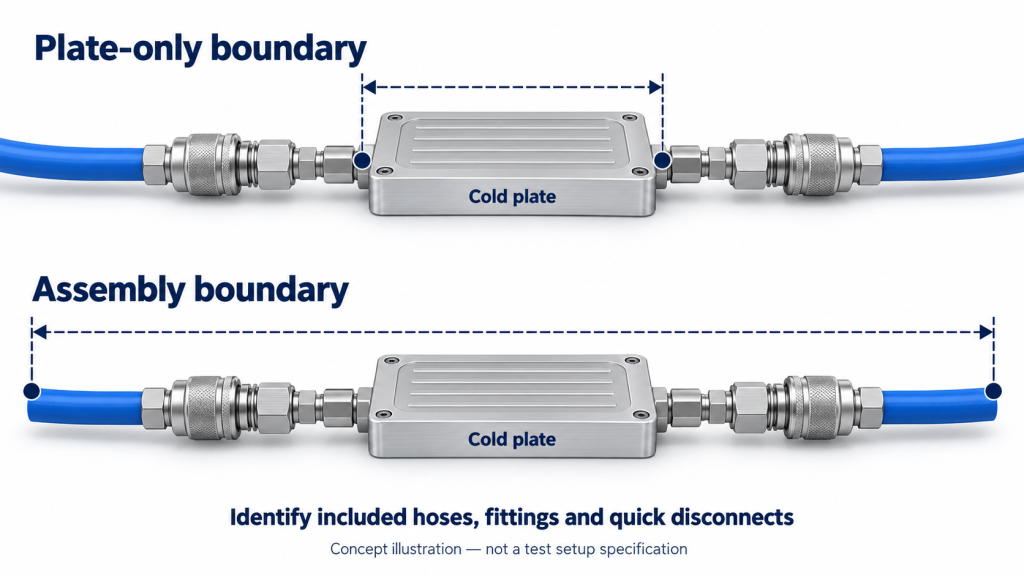
Mark the pressure-tap locations on the assembly drawing. List the included components and exclusions, identifying hose dimensions and connector configurations where relevant. Ask whether fixture losses remain in the reported result or have been removed. OCP provides an example of comparing a loop with and without the cold plate at the same flow.
When one supplier measures the plate and another measures a hose-and-plate assembly, align the boundaries before judging the difference. Do not assume the smaller number identifies the better design.
For the final proposal review, state whether the pressure-drop requirement applies to the cold plate itself, a server assembly or another defined section of the loop.
Compare Supplier Proposals at Your Required Operating Point
Use a comparison sheet to identify missing information before ranking proposals. The blank table below is a review template, not a comparison of actual suppliers.
| Review item | Supplier A | Supplier B |
|---|---|---|
| Coolant, concentration and temperature | — | — |
| Flow through the defined component or assembly | — | — |
| Included components and pressure-tap locations | — | — |
| Pressure drop at the selected flow | — | — |
| Thermal definition and result at that flow | — | — |
| Measured or simulated data; sample and drawing revision | — | — |
Enter actual values and units, or mark “not supplied.” A missing field means the comparison is incomplete; it does not establish poor performance.
Ask for data at or near the required operating point. If conditions differ, identify what needs retesting or engineering justification. Keep predicted results distinguishable from sample measurements rather than treating both as equivalent evidence.
Check the differential-pressure budget available to the relevant branch after other circuit losses are considered. Neither static system pressure nor a pump’s headline rating establishes what is available across one cold plate. Grundfos’s pump-curve guidance explains why flow and differential head must be considered with system characteristics.
For a custom manufacturing discussion, share your drawing and existing pressure-flow data with Ecotherm through our custom liquid cold plate page. Include the coolant, temperature and intended flow so the requirements can be reviewed in context.
If no curve is available yet, send the drawing and known flow or pressure targets. Clearly identify the missing information; you do not need a completed test report to start the conversation.