CFD & wind-tunnel data reduction
Resistance Curve Fitting Tool
Turn measured or simulated velocity–pressure-drop points into a clean resistance equation. Compare fit quality, predict a design point, and derive porous-media coefficients for a heat sink core or cooling module.
1Paste or enter dataUse face velocity and static pressure drop across the sample.
2Select the physical modelUse Forchheimer unless the data supports a simpler law.
3Check before exportingReview residuals, test range and coefficient signs.
m/s
Fit and design-point check
Forchheimer viscous + inertial resistance
Velocity–pressure-drop curve
DataFit
R²—
RMSE—
Max residual—
Data range—
—
—
Fitted resistance equation — SI units
—Pressure drop at design velocity—Interpolation inside measured range
Loss coefficient at design point—ζ = 2ΔP / (ρV²)
Design volumetric airflow—Shown when frontal area is entered
Resistance trend——
Porous-media export (from aV + bV² model)
Viscous resistance 1/α—
Inertial resistance C₂—
Linear coefficient a—
Quadratic coefficient b—
Use only within a comparable flow regime and geometry. A strong fit does not guarantee similarity outside the tested velocity, density, Reynolds-number, flow direction or installation range. Check probe zeroing, pressure-tap position, leakage and mesh independence before treating coefficients as product data.
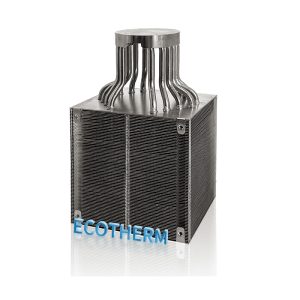
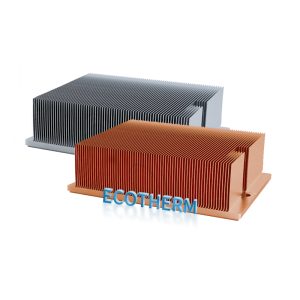
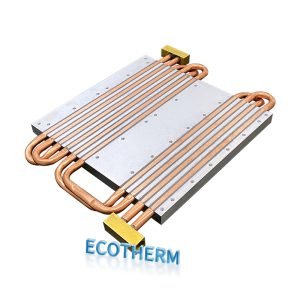
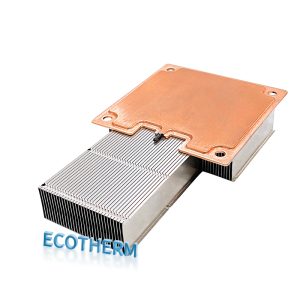
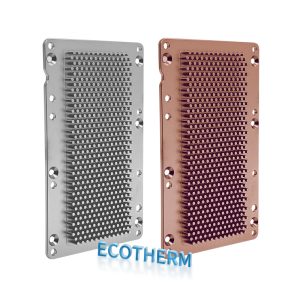
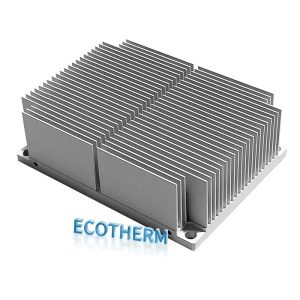
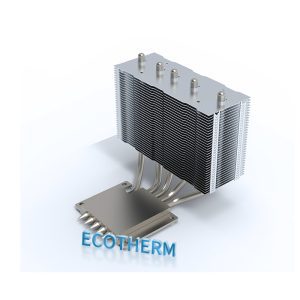
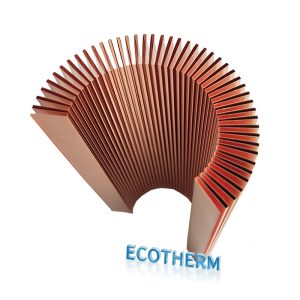
This tool supports pressure-loss characterization of heat sinks, folded/zippered fin cores and cooling modules. For a manufacturable review, share the core drawing, flow direction, frontal area, depth, CFD boundary conditions and raw wind-tunnel data.